

A guided Excel setup starts with a clear workbook structure: use consistent column headings, enter related records in rows, then add formulas to calculate and check the data. From there, you can sort and filter information, format it as a table, and build charts or PivotTables to make results easier to review. A sound layout makes these later steps more straightforward.
Excel can feel difficult when formulas, cell references and data tools all appear at once, but you don’t need to learn everything before you begin. This guide covers practical starting points, from opening a workbook and moving between cells to using common calculations and organising records. You’ll also learn how to create tables, charts and PivotTables, and choose the right tool for each task. Each step builds on the last, helping you create a spreadsheet that is useful, readable and easier to maintain.
Key Takeaways
- Start with clear headings and consistent rows so your workbook is easier to use as it grows.
- Use formulas and cell references to calculate totals and other useful results from your data.
- Sort and filter records carefully, then use tables, charts and PivotTables to make information easier to review.
- When you need help shaping an Excel workbook around a business process, SNolom Systems (Pty)’s Guided Quick-Start is a practical next step.
Using formulas, functions, and cell references
- Choose a template that suits the task, such as tracking invoices or expenses. Excel’s built-in templates work well for standard needs; a guided Excel setup with a simple starter workbook can better suit a workflow with specific fields and calculations. Keep each worksheet focused on one purpose, such as recording sales separately from expenses.
- Enter a formula in the first result cell, starting with an equals sign. For an invoice line, use
=B2*C2to multiply quantity by unit price. Copy it down the column: relative references adjust for each row. - Use functions for common financial calculations. Select the cell below a list of amounts, then choose AutoSum to total the column. From its dropdown, choose Average for the mean, Count Numbers for numeric entries, or Max and Min for the highest and lowest values. Format the result as currency or a percentage to make its meaning clear.
- Check calculations with formula auditing tools. Select a result, then trace its precedent cells to see which inputs feed it. Inspect copied formulas for shifted references. For grouped totals, use Subtotal to group records by a field, such as department, and apply Sum to an amount column. Grouping works best when records follow a consistent structure.
- Set up formatting and data validation alongside your formulas. Select cells and use Format Cells to apply number formats; use Data Validation to restrict entries, such as choosing a status from a list. If a formula returns an error, check its cell references and input types first.
#REF!signals a broken reference;#VALUE!often indicates an unsuitable input.
Organising, sorting, and filtering data
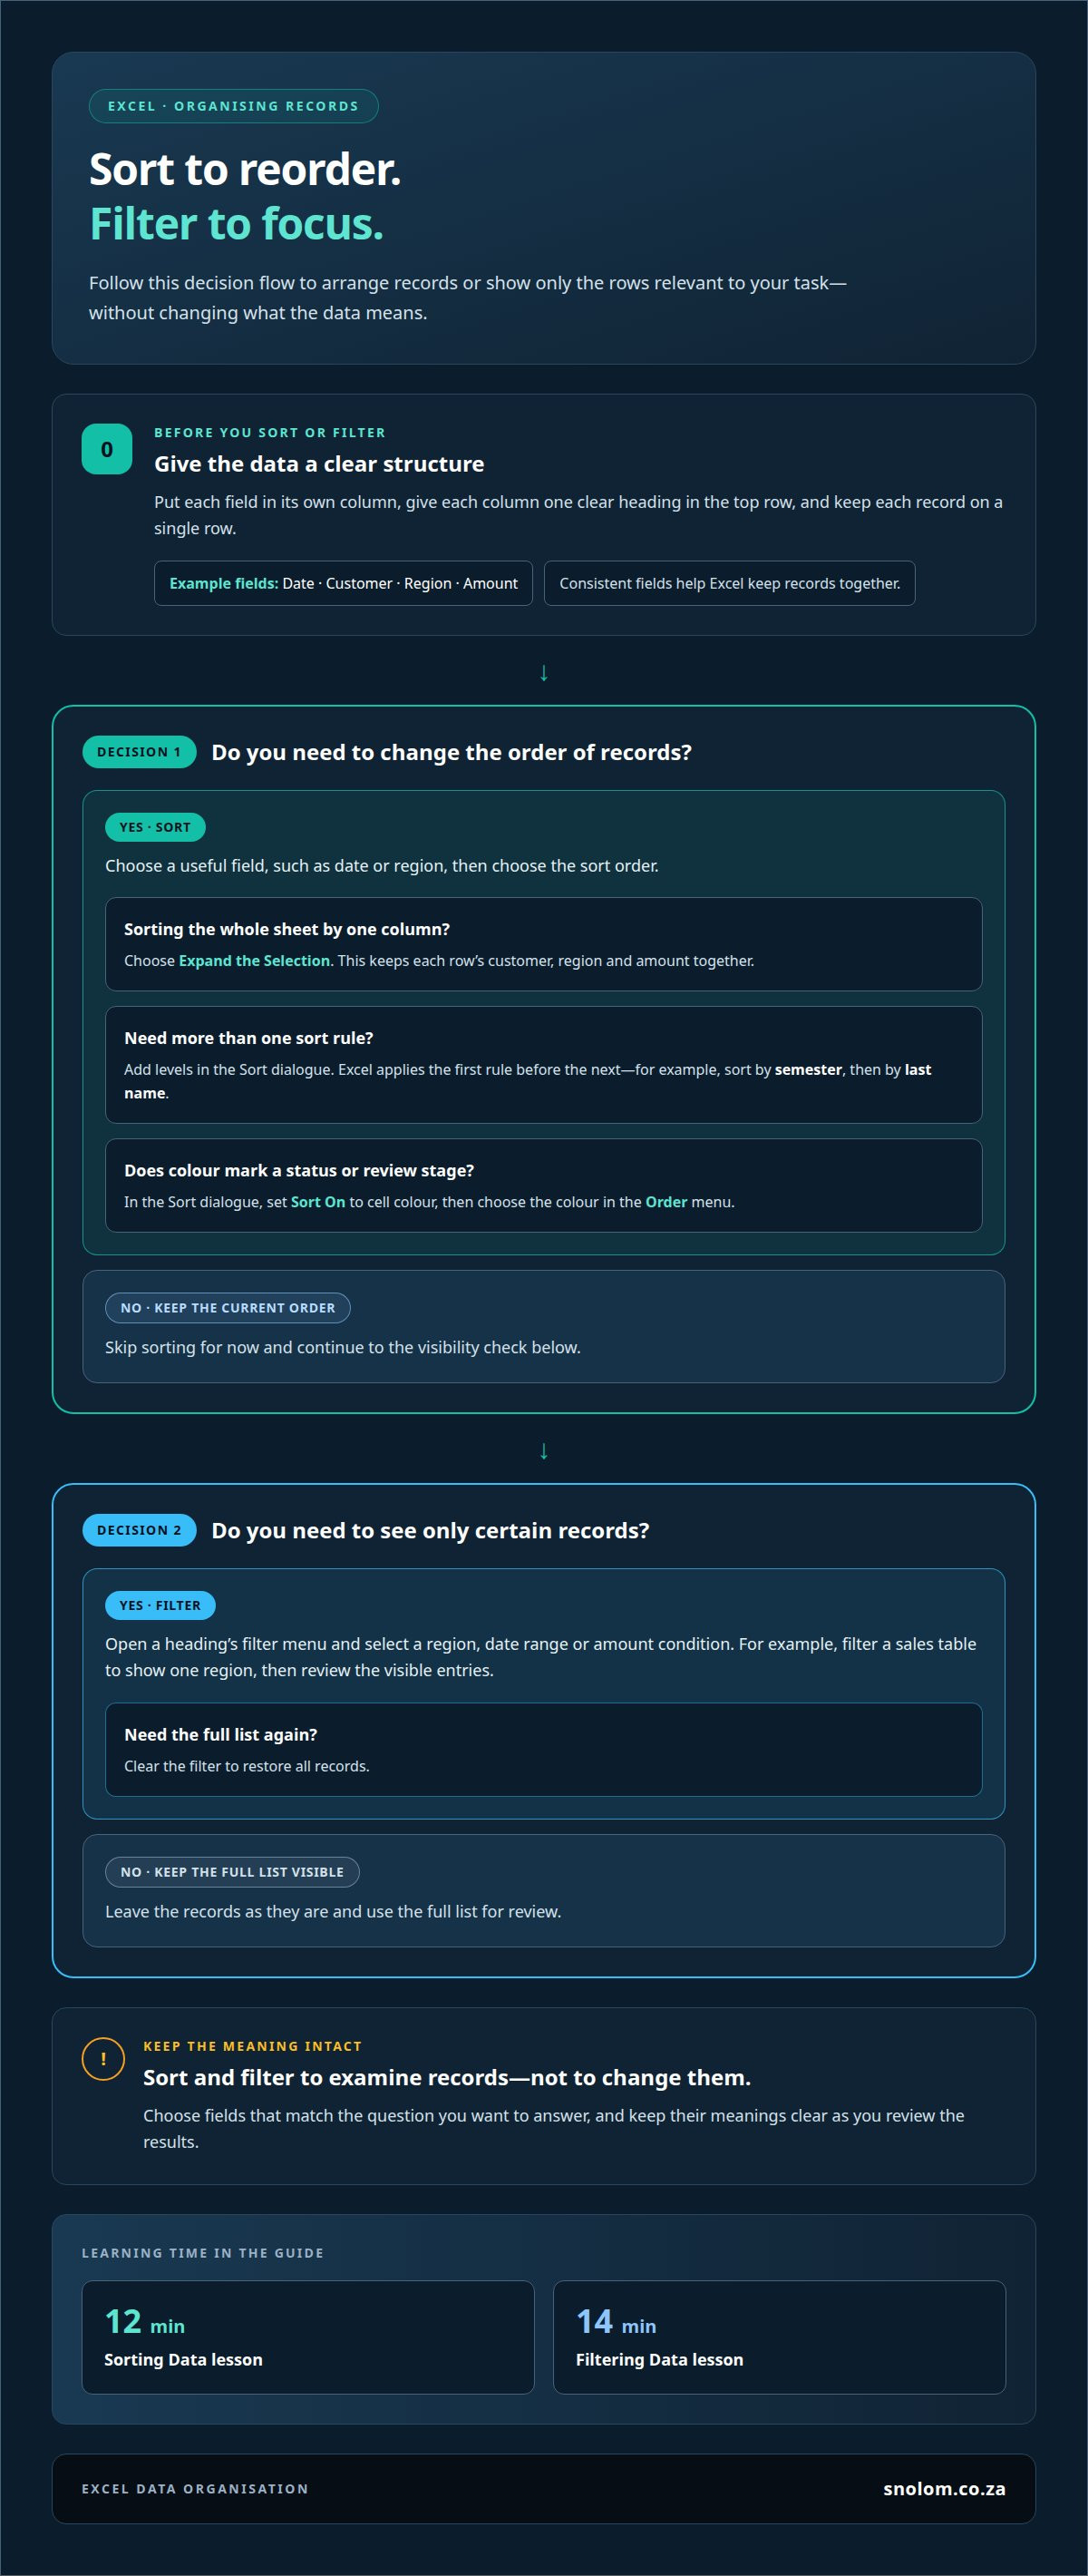
- Give each field its own column, with one clear heading in the top row, and keep each record on a single row. For example, a sales sheet might have headings for date, customer, region and amount. Consistent fields help Microsoft Excel sort complete records and filter them accurately.
- Sort records by a useful field, such as date or region. Select a cell in that column, then choose the sort order. If you are sorting the entire data sheet by one column, choose Expand the Selection. This keeps each row’s customer, region and amount together instead of separating values from their records.
- Use a multi-level sort when one field isn’t enough. In the Sort dialogue, add levels to sort first by semester, then by last name. Excel applies the first rule before the next, making grouped records easier to scan. The Sorting Data lesson lasts 12 min, a practical target for learning this process.
- Filter records to display only the rows relevant to a task. Use the heading’s filter menu to select a region, date range or amount condition. For example, filter a sales table to show one region, then review its visible entries. Clear the filter to restore the full list. The Filtering Data lesson lasts 14 min.
- Sort by cell colour when colour marks a status or review stage. Open the Sort dialogue, set Sort On to cell colour, then choose the colour in the Order menu. Use filters and sorts to examine records, not to change their meaning. For repeatable reporting that needs a clear data structure, explore Excel data and reporting setup.
A multi-level sort sets a primary grouping followed by a secondary order. For example, Excel can sort data first by semester and then by last name. Choose fields that match the question you want to answer, and keep their meanings clear as you review the results. This makes the order purposeful without changing the records themselves.
Colour-based sorting offers another way to arrange marked entries. Excel can sort a data table by cell colour using the Sort On option and a selected colour in the Order menu. Choose the colour criterion that matches the status you want to examine, then interpret the order in that context. Both methods help focus attention on relevant records while keeping the underlying information intact.
Creating tables, charts, and PivotTables
- Select the full data range, including its column headings, then choose Table on Excel’s Insert tab. Check that the header row has one label per field, such as Date, Region and Sales. A table gives records a consistent structure for later analysis.
- Choose a table style that keeps headings distinct from data rows. To define your own style, open Format as Table and select New Table Style. Use restrained colours and clear contrast so headings remain readable on screen or in print.
- Choose chart data that answers one specific question. Select the category labels and values, then use the chart options on Excel’s Insert tab. A column chart can compare sales across regions; a line chart can show monthly movement. Keep the chart focused on one comparison.
- Review the chart title, labels and scale after inserting it. Replace the default title with a useful description, such as “Sales by Region”. Confirm that the horizontal labels name the categories and the vertical axis represents the amounts. Remove extra legend entries if the chart has only one data series.
- Create a PivotTable by selecting a cell in the data range and choosing PivotTable on the Insert tab. Place Region in Rows and Sales in Values to summarise sales by region. Add Month to Columns to compare periods. Move fields between areas to answer a different question without rearranging the source records.
- Check the summary against its source data before sharing it. Confirm that the PivotTable includes the intended records and uses an appropriate calculation for Sales. If you no longer need a regular table, select it, choose Convert to Range, then confirm. The data remains, but table-specific behaviour is removed.
Getting started with Excel
- Open Excel and choose a blank workbook or a suitable template. A blank workbook gives you control over the layout; a template provides a prepared starting point for tasks such as tracking expenses. Give the file a clear name before entering information so it is easy to identify later.
- Start with the workbook structure. Use the worksheet tabs to separate related tasks, such as monthly records and a summary. Rename each tab to describe its contents. The Creating and Opening Workbooks lesson lasts 10 min, a focused introduction to opening and managing files.
- Can you use Excel for free in South Africa? Access depends on the version and the terms for your account. Browser-based Excel and the installed desktop application are different options, so identify which one you need before setting up your workbook.
- To download and install Microsoft Excel in South Africa, sign in to your Microsoft account and use the installation option available for your account. Follow the on-screen installer, then open Excel and sign in if prompted. This distinguishes installing the desktop application from using Excel in a browser.
- Move through a worksheet with the arrow keys. To select a continuous range, choose its first cell, hold Shift, then choose its last cell. For example, selecting A1 through D5 highlights a five-row, four-column block for an operation such as formatting or copying.
- Save the workbook in a location you can find again, then reopen it to confirm the file works. If the workbook needs to fit a defined business process, get help setting up Excel with a practical starting structure.
In Excel, the arrow keys move the selection from one cell to another. Use them to keep the active cell aligned with the part of the worksheet you are handling. Check where the selection lands before continuing, so your next step starts in the intended cell. Moving cell by cell can help you stay oriented as you work through the worksheet.
SNolom Systems (Pty) Ltd: Guided Quick-Start
SNolom Systems (Pty) Ltd helps turn Excel knowledge into a workbook built around a practical business task. Its Guided Quick-Start suits those who need a structured starting point, while Data & Reporting Setup is relevant when the priority is clearer reporting from business data. For connected processes, Workflow & Automation Build or Business System Build may be a better fit.
The work follows a defined process. Prices are shown before building, and the final scope is confirmed in writing before payment. You can see what the setup covers before work begins.
To get help setting up an Excel system for your workflow, contact SNolom Systems (Pty) Ltd to discuss the task and the outcome you need.
Build your next workbook around the work
A useful spreadsheet should fit the decisions and routine tasks it supports. Before adding sheets or calculations, decide who will use it, what information they need to record, and which results should guide action. This gives a guided Excel setup a clear purpose from the outset.
If building that structure takes more time than the spreadsheet itself, SNolom Systems (Pty) Ltd offers Guided Quick-Start, Workflow & Automation Build, and Data & Reporting Setup. The right option depends on whether you need help getting started, connecting a workflow, or presenting business data clearly.
Bring your workbook requirements into a conversation, including the task it should support and the information it needs to handle. Contact SNolom Systems (Pty) Ltd for support to discuss a practical next step. A clear scope makes it easier to move from an empty workbook to a tool that supports your work.
Frequently Asked Questions
What does guided Excel setup include?
A guided Excel setup can include a workbook structure, formulas, data checks and a handover suited to the task. For example, SNolom’s Guided Quick-Start sets up a pre-built system around your data and team, with a guided session and handover. Workbook components depend on the process it needs to support, such as tracking requests or preparing internal summaries.
How to set up Excel step by step for beginners?
Begin with one task, such as logging customer enquiries. Create a workbook, label the fields people must complete, then enter sample records. Check that dates, names and status values are consistent before using the sheet for live information. Ask someone unfamiliar with the layout to enter a sample record; any difficulties can reveal unclear headings or missing instructions.
How to create an Excel workbook with guided instructions?
Start with a blank workbook or a relevant template, then add a short instruction beside each field that needs explanation. For an enquiry log, define what belongs in “Status”, such as “New” or “Resolved”. Add a separate notes sheet for procedures and ownership. Test the instructions with a sample entry, revise unclear wording, and save a clean copy before routine use.

